
 Home
Home
Examining cannabis through the available data gives us certainty. Numbers are precise. Statistics settle arguments and help place issues into context. So we’re taking a closer look at cannabis data in terms of arrests, use, cultivation, availability and consumption to find out what the numbers tell us about marijuana in the United States.
According to the annual National Drug Threat Assessment (NDTA), which is put together by federal law enforcement, “Marijuana is the most widely available and commonly used illicit drug in the United States.” This article looks more closely at just what that statement means.
The data in this article was all produced by the federal government. In that respect, it also reveals what information the government has about marijuana and marijuana users. The truth is that the government knows how many people use marijuana, that prohibition has not reduced or even controlled marijuana use, and that the goal of using prohibition to discourage marijuana use is a delusion. The government is also aware that under prohibition the United States has become the premier producer of marijuana in the world, setting the global standard for cannabis cultivation. Just about anyone in the United States who wants marijuana can find it easily, and what they find is generally of the highest quality. The government also knows that the spread of cannabis legalization is draining prohibition of any credible justification for its continued existence.
Arrests and Use
Roxanna Allen
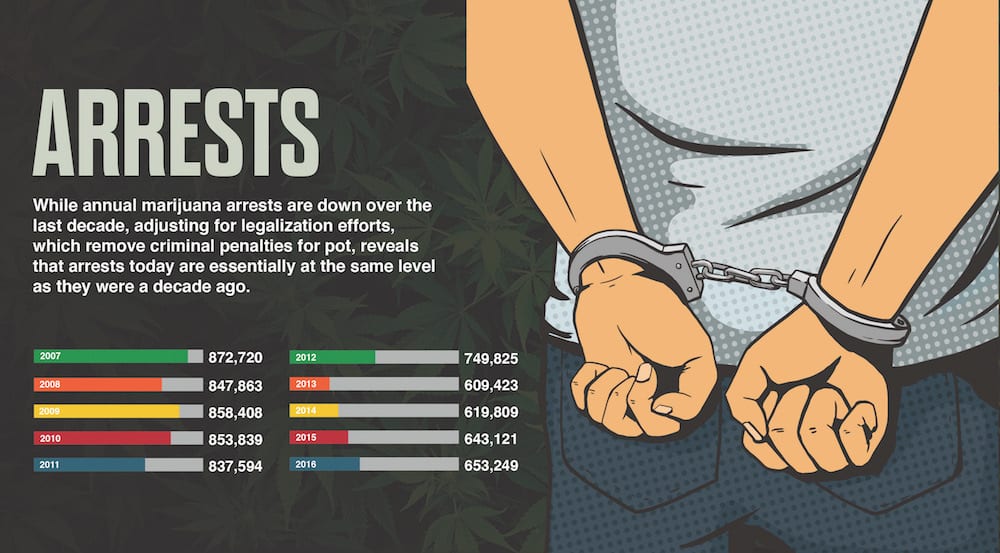
In the United States, cannabis legalization began to be implemented in 2013. The criminal penalties ended by state legalization and decriminalization accounted for approximately 20 percent of annual marijuana arrests from 2001 to 2010.
In 2007, 872,720 total marijuana arrests were made nationwide. That’s the largest number of marijuana arrests ever made in a year. Taking those 872,720 arrests as a starting point, the elimination of 20 percent of these due to changes in state laws provides a baseline of 698,176 arrests. Thus the average number of arrests for 2015-16 of nearly 648,185 represents just a 7 percent reduction in marijuana arrests nationwide from 2007 and just a 5 percent reduction from 2010, the second-largest year for marijuana arrests (853,839).
The average number of annual marijuana arrests from 2001 to 2010 was 799,641. Reducing this by 20 percent to account for recent reform efforts that eliminate criminal penalties provides a baseline of 639,713 annual arrests. Compared to this baseline, the average number of arrests for 2015-16 represents an increase of 1.3 percent. Marijuana arrests today are essentially at the same level as they were a decade ago.
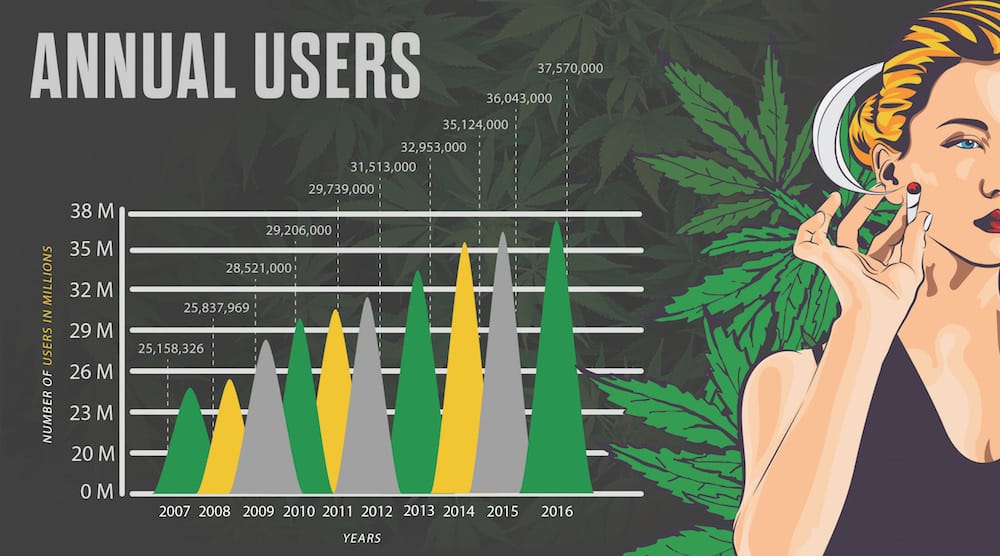
By 2016, over 118 million Americans had used marijuana at least once in their lifetime. There were 37.6 million annual marijuana users in 2016, of which 24 million had used marijuana in the past month (and are considered regular users of cannabis). In 2016, annual marijuana use was reported by 13.9 percent of Americans, up from 11.5 percent in 2011. Past-month use increased from 7 percent in 2011 to 8.9 percent in 2016.
As noted above, legalization has removed the threat of arrest for millions of marijuana users. Thus, while the number of arrests in non-legalization states has remained about the same as it was 10 years ago, the number of annual marijuana users has increased by about eight million, and the number of regular users has increased by about six million. So what does this say about the effectiveness of prohibition?
First, it is helpful to have some context here with respect to the extent that various crimes result in arrests. The technical designation is “offenses cleared by arrest,” which just means “arrested.” Second, such data should be looked at in terms of deterrence. There are two ways to look at this. Specific deterrence concerns the impact of arrest on the person arrested; the issue is the extent to which an arrest for a crime discourages or prevents an individual from committing that crime in the future. General deterrence concerns the impact of a potential arrest on other offenders; the prospect of arrest should discourage others from breaking the law. In 2016, about 45 percent of violent crimes reported to the police were cleared by arrest. The highest clearance percentage was for murder, with 59.4 percent of murders resulting in an arrest. Other clearance percentages for violent crime are as follows: rape (35.6 percent), robbery (29.6 percent) and aggravated assault (53.3 percent). For property crime, the clearance percentages are much lower, 18.3 percent overall, with 13.1 percent for burglary, 20.4 percent for larceny and 13.3 percent for motor-vehicle theft.
In 2011, there were 29.7 million annual users of marijuana. Of those cannabis users, 742,657 were arrested (only 2.5 percent). There can be no argument that this arrest level is effective in deterring people from using marijuana when this figure is compared with the clearance percentage of violent and property crimes.
Worse, in terms of the effectiveness of prohibition, the percentage of marijuana users arrested by police has been steadily decreasing over the last several years. This is no surprise, as several states have stopped arresting people for cannabis use. But in terms of national prohibition, the maintenance of arrest levels in non-legalization states is not sufficient to maintain the overall impact of this policy. The percentage of marijuana users arrested under prohibition laws has been decreasing from 2.5 percent in 2011 to 2.1 percent in 2012 and 2013, down to 2 percent in 2014 and now down to just 1.6 percent in 2015 and 2016.
Abuse
Roxanna Allen
In 2015, there were 213,001 admissions to treatment services for which marijuana was the primary substance of abuse, down from 352,396 in 2011 (a reduction of nearly 40 percent). According to the Treatment Episodes Data Set from the federal Substance Abuse and Mental Health Services Administration, marijuana accounted for 13.9 percent of treatment admissions in 2015, compared with 18.2 percent in 2011. However, 51.4 percent of marijuana-treatment admissions were a result of a referral from the criminal-justice system—most of these individuals had entered a drug-treatment program as a condition of probation, parole or other court directive. Furthermore, over half (54 percent) of marijuana admissions involved one or more other substances, frequently alcohol and/or cocaine as well as methamphetamine.
Just over 85 percent of treatment admissions were given some form of outpatient treatment. Only 45.2 percent of all marijuana-treatment admissions were diagnosed with cannabis dependency, according to professional clinical standards. Another 31.8 percent were diagnosed with cannabis-abuse problems. While this indicates that many marijuana-related treatment admissions had a clinical basis for treatment, 23 percent (about 49,000) of them did not. To summarize some key statistics here, out of 213,001 treatment admissions for marijuana, just over 109,000 people were referred to treatment by the courts, close to 76,000 had not used marijuana in the last month and 49,000 had no clinical basis indicating a problem with marijuana use.
Also of note, 41.1 percent of marijuana admissions for treatment were not covered by health insurance and another 39.4 percent were covered by Medicaid. In cases where an individual had no insurance, his or her treatment was usually paid for by some form of government payment. Consequently, most people in drug treatment for marijuana were there as an alternative to incarceration, with many agreeing to enter treatment even if they did not have clinical problem with abuse or dependency, and most of the cost of this practice was paid for by taxpayers.
Cultivation, Availability and Consumption
Roxanna Allen
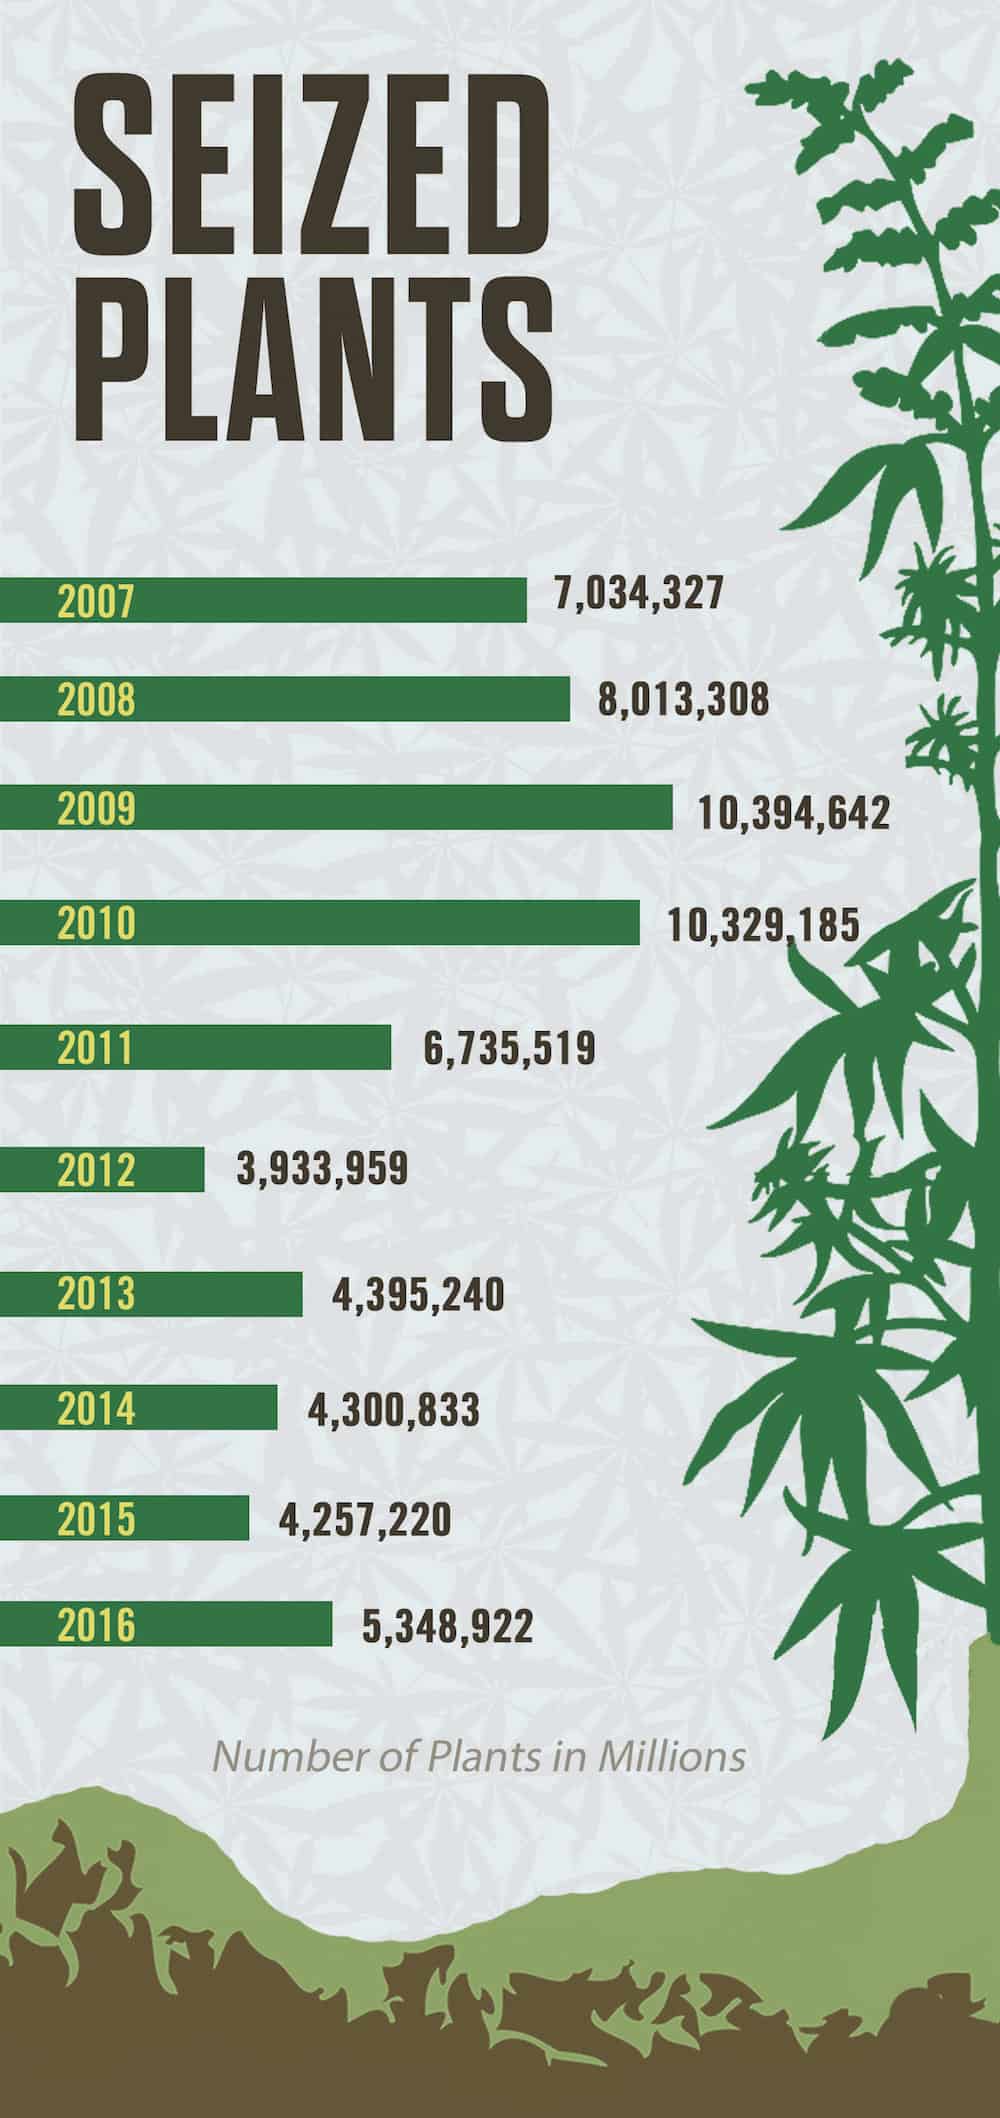
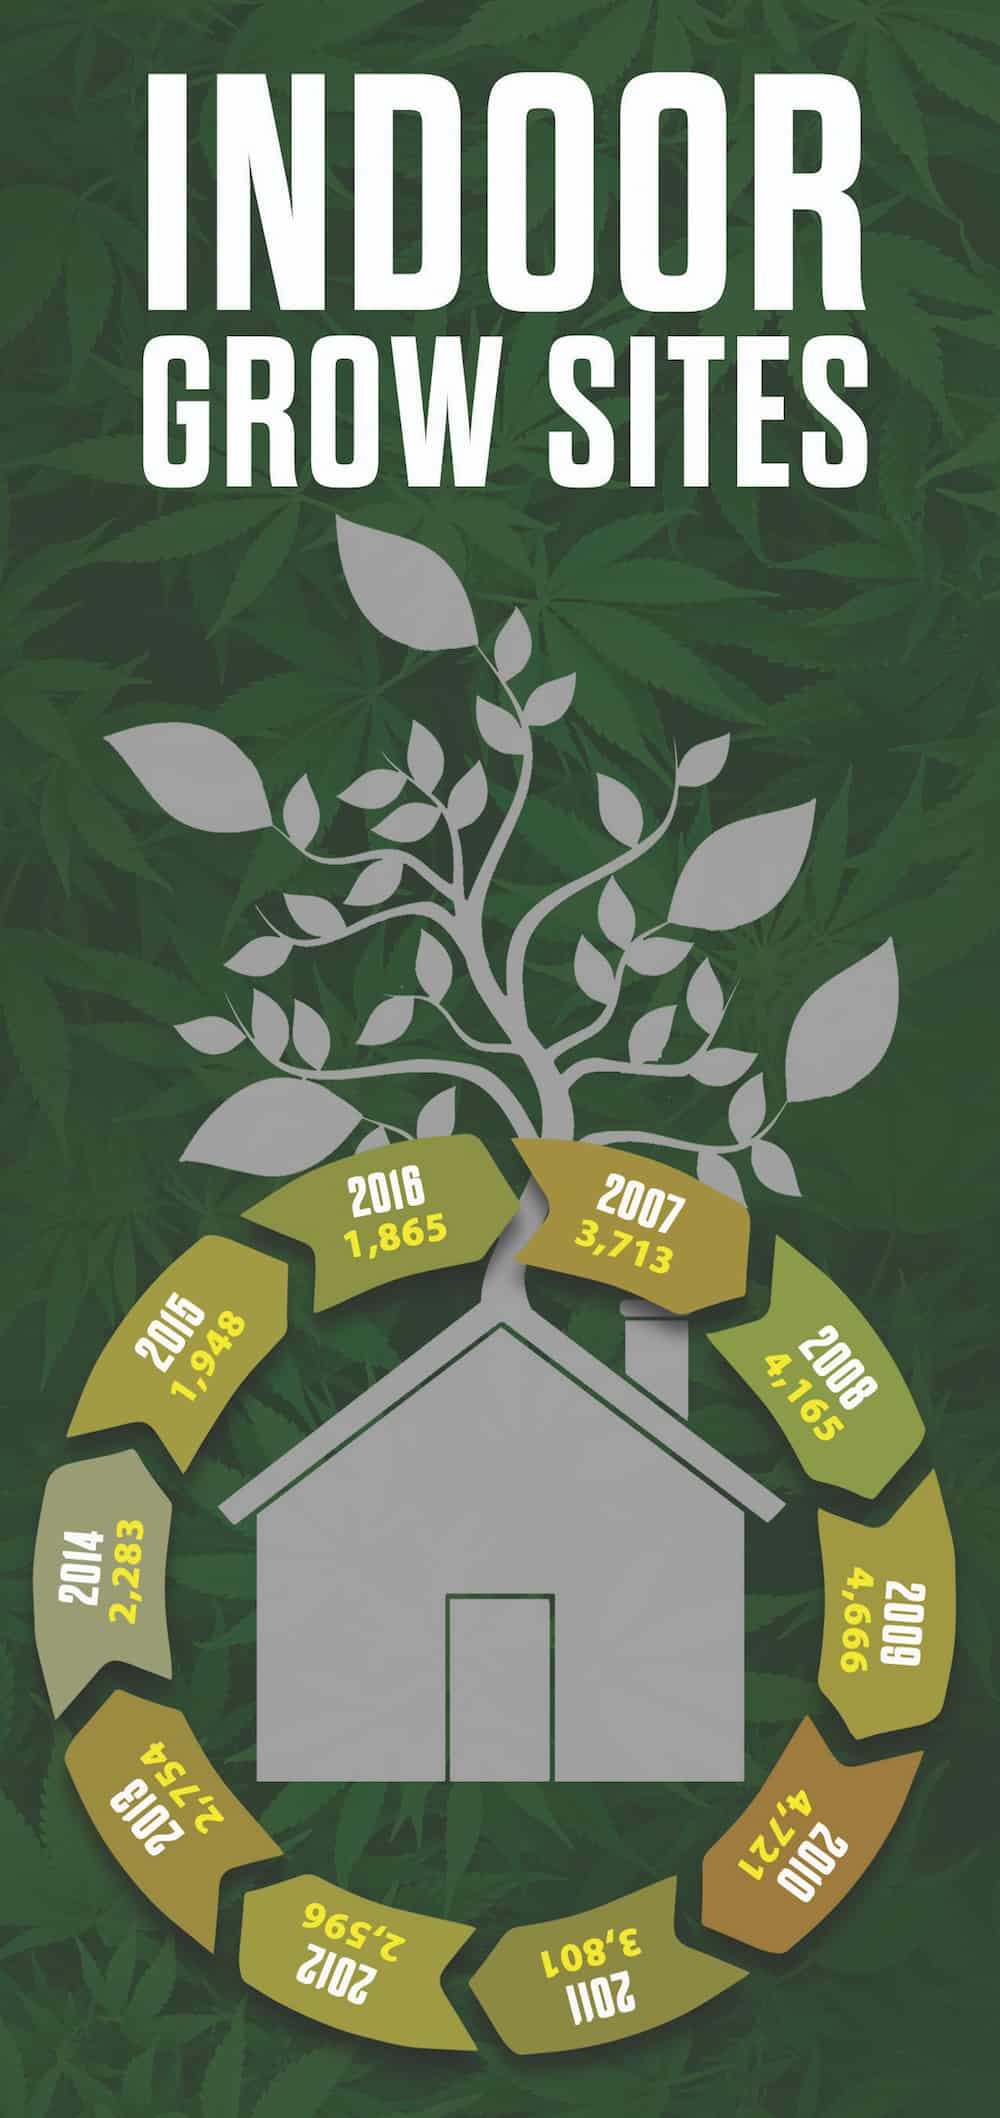
In 2016, the Drug Enforcement Administration (DEA) seized 5,348,922 marijuana plants in the United States. Of these, 4,942,797 were from outdoor grow sites while 406,125 were from indoor grow sites. Agents raided 5,528 outdoor grow sites and 1,865 indoor sites. The DEA’s Domestic Cannabis Eradication/Suppression Program made 5,657 arrests and seized assets valued at close to $52 million. These figures were comparable to the past five years. While arrests were down in recent years, overall plant seizures increased in 2016 from the prior five-year average of 4.7 million. The number of indoor sites raided in 2016 was below the prior five-year average of 2,676, but the number of indoor plants seized was greater than the five-year average of 378,995.
Asset seizure increased substantially compared with the prior five-year average of $32 million.
Most of the DEA plant seizures in 2016 were in California (71 percent) and Kentucky (10 percent). Other states of interest, with over 100,00 plants seized, were Texas, Tennessee and West Virginia. California also had the most indoor grow sites seized (643), followed by Michigan (207), Indiana (164), Florida (152) and Kentucky (95).
The NDTA reports that 80 percent of responding agencies rated marijuana availability as high, and 16 percent rated availability as moderate. Availability increased over the past year in 34 percent of these jurisdictions, while 61 percent reported it was about the same. Demand also increased in 29 percent of the jurisdictions.
The National Survey on Drug Use and Health reports that in 2015, 56 percent of Americans found marijuana was fairly or very easy to obtain. This figure increased to 71 percent for those in the 18-to-25 age group. However, among annual marijuana users, 89.4 percent report that marijuana was fairly or very easy to get.
The 2014 National Survey on Drug Use and Health (NSDUH) reports that only 17.1 percent of marijuana users bought marijuana from someone they just met or did not know well. Over three-fourths (77.6 percent) bought marijuana from a friend, and 5.4 percent bought marijuana from a relative or family member. Marijuana was most often bought inside a home, apartment or dorm (51.7 percent), while 17 percent bought marijuana outside in a public area or parking lot. However, a follow-up question with more detailed options provided more detail about pot purchases as 18 percent responded that they bought it in a medical marijuana dispensary or club. Most people were not able to buy marijuana near where they lived, with 42.7 percent reporting that they could do so and 57.2 percent reporting purchasing it somewhere else. Almost all respondents (95.3 percent) did not sell any marijuana from what they most recently purchased. On the other hand, 52.9 percent reported sharing or giving some of their last pot purchase to someone. Most marijuana consumers (66.2 percent) bought between one and less than five grams during their most recent purchase, with 26.4 percent reporting a purchase of five to less than 10 grams and 7.4 percent reporting a purchase of 10 grams or more.
Additionally, the 2015 NSDUH reported that 2,297,279 Americans 18 years and older sold illegal drugs along with 339,488 teenagers—bringing the total number of estimated US drug sellers to 2.6 million.
As of February 1, 2016, the NDTA was aware of 1,473 licensed medical-marijuana businesses in Colorado. It notes that, at the time, 25 states and Washington, DC, had approved medical marijuana. In 2016, federal law enforcement was also monitoring legalized marijuana in Colorado, Washington, Oregon, Alaska and Washington, DC, as well as keeping track of state approval for cannabidiol (CBD) in 17 states and industrial hemp in 27 states.
Federal law enforcement, in looking for new issues of concern regarding marijuana cultivation, reports in the 2016 NDTA that “Electricity and water consumption are increasing in some localities due to increasing domestic cultivation from both state-approved and illicit grows. A 2012 study estimated the energy consumption for indoor cannabis production is around one percent of national electricity use, or $6 billion each year. This study also claims that one average kilogram of final marijuana product is associated with 4,600 kilograms of carbon dioxide emissions into the atmosphere. Open source reporting shows that more than 1,200 licensed growing facilities use roughly half of Colorado’s new power demands and, last year, those facilities combined to use about the same amount of energy as 35,000 households.”
Another concern of federal law enforcement has been the increasing potency of marijuana. In 2014, its testing of seized samples of marijuana indicated an average potency of 12 percent with the highest level reported to be 37 percent. In 1995, the average potency was just 3.95 percent. The average THC level of concentrates in 2014 was 55 percent, compared to 13 percent in 1995. Some concentrate seizures have tested above 82 percent THC.
According to the NDTA, the United States consumes between four and eight million kilograms of marijuana each year, with considerable commercial- and low-grade marijuana being imported from Mexico (though imported marijuana is now recognized as inferior to domestically produced marijuana). “In 2015, ArcView, a market research firm for investors in the state-approved marijuana industries, reported $5.4 billion dollars in state-approved marijuana sales in the United States, up from $4.6 billion dollars the previous year.”
The Future
Roxanna Allen
One area in which the federal government has it completely right concerns the future of marijuana in the United States. According to the NDTA, “Domestic use of marijuana will remain high and is likely to increase. Domestic production and trafficking of marijuana will likely increase as more states adopt relaxed marijuana laws.” The feds believe state legality will be exploited to produce marijuana for sale in other states; while they would be hard-pressed to admit it, this is just one more argument for nationwide legalization.
The NDTA also forecasts ongoing trafficking of Mexican marijuana, and that imported marijuana will increase in quality to compete better with domestically grown cannabis. “Fragmented and developing medical and personal use laws” create a lot of uncertainty for the public and for the marijuana industry, and this makes the issue much more complicated and complex for everyone involved, including the public, law enforcement, financial institutions and the medical community. But one thing is certain, and on this the marijuana community and federal law enforcement are in total agreement: “Marijuana will remain a part of domestic and international political discussions for the foreseeable future.”
This feature has been published in High Times’ magazine, subscribe right here.
The post Marijuana by the Numbers appeared first on High Times.


0 DL LiNKS:
Post a Comment
Add yours...